Musiclight
Hi again!
This time I’d like to show another project I’ve worked on recently. I call it “Musiclight”, as that describes quite well what it’s all about :-) .
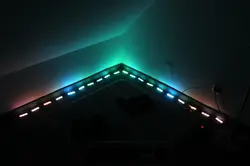
My goal is to visualize music using RGB LED strips, in a way that it actually enhances the listening experience (for example, impressive transitions in the music should cause impressive transitions in the light).
The idea for this existed for more than 2 years (I learnt how a DFT worked around that time ;-) ), and I tried different methods of visualization since then.
The Hardware
Most of the time, I used a simple RGB LED strip which could only have one color at a time. I tried calculating colors directly from the music (which caused extreme flickering) and extreme averaging (which turned out to be the best solution for single-color strips, as it showed the “mood” of the music over a longer time). However, I recently got my hands on a LED strip with multiple, individually setable modules (see this search), which made totally new things possible.
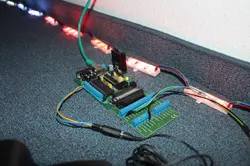
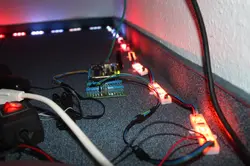
The RGB LEDs on each module are controlled by a WS2801 chip, which features a serial (shift-register like) interface and 3 output channels with 8-bit PWM. The modules can be daisy-chained to make longer strips which can still be controlled by a single microcontroller. The strip I’ve got consists of 20 such modules.
To be able to control the LEDs using my laptop, I wrote a driver for the Ethersex firmware, which runs on my AVR Net-IO. The driver takes commands through a binary UDP-based protocol and sets or fades the module’s colors accordingly. The LEDs are updated in fixed intervals of 40 milliseconds, which is enough to remove any visible steps in fading.
Here are some pictures of the hardware setup:
The Software
On the laptop, I wrote a program that takes audio samples as input, does it’s calculations to generate some nice visualization and sends the result to the Net-IO.
Currently, the algorithm works roughly as follows:
- Calculate the FFT of the incoming samples
- Divide the FFT into three frequency bands: 0 - 400 Hz, 400 Hz - 4 kHz, 4 - 20 kHz. For each band, calculate the “total energy” and convert that into a brightness value. This brightness value is then mapped to the red, green or blue channel.
- Move each module’s color value to the next module and insert the new color at the first module.
You can get the code from my git server. Or clone it directly:
git clone https://git.tkolb.de/Musiclight/musiclight2.git
Please note that the program is not really portable in it’s current state.
Demo Video
I hope you’re still with me, as here comes the interesting part: A demo video!
There is also a high-quality version with better sound quality and full 720p resolution (all my DSLR could give me at 30 fps :-) ). And yes, the music is edited in, but there was no significant delay between music and visualization in the real world, too ;-) (and you wouldn’t want to hear the original recording from the DSLR anyway, would you?).
The song in the video is taken from Professor Kliq’s album “Curriculum Vitae” and is available under the terms of the CC BY-NC-SA 3.0 license.
Future Plans
Despite the current visualization looks really good (in my opinion), there are still some things that I’d like to improve.
- The first and most important missing feature is some kind of scripting support, which makes it easier to change the visualization algorithm and the configuration (now one has to recompile the program every time anything has to be changed).
- Ultimately, a real hardware implementation would be nice, so you have a device you can plug between your CD/MP3/whatever player and the amplifier and get a nice visualization. However, that goal is currently far out of my reach.


